Guide
Competitor benchmarking: five steps for public pages
By coExploro · Published
Reviewed and edited by coExploro · Independent, not affiliated · Public methodology · Corrections: support@coexploro.com
Competitor benchmarking assesses your product against the alternatives a buyer considers, using shared measures and documented evidence. Public pages let you check positioning, pricing, the first action a page offers visitors and the user experience (UX) of the pages. Sales, retention and market share need other data. coExploro makes a product teardown of each product’s public pages and drafts findings on them, usually in 2–4 minutes.
- Choose one decision and the products — include your own product and the alternatives a buyer considers for one task, budget and team size.
- Define each check and any scoring rules before you look — specify the answer format and what each score means, then apply the same rules to every product.
- Capture equivalent pages under matching conditions — use a short collection window, match page settings, and record the capture time and any missing pages.
- Record observations using the rules you set — use yes or no, a count or the exact wording, as each check specifies, and mark missing evidence as unknown.
- Choose a next step and record open questions — state each relevant gap and its evidence, then choose a change or a test, an owner and a measure of success.
What to benchmark, and where each measure comes from
A benchmark is only as good as its checks. Turn each topic into a check with a clear answer: does every plan show a price, how many fields does the sales form mark as required, what does the first screen ask a visitor to do? Match the answer format to the check: yes or no, a count, or the exact wording. Record missing evidence as unknown, never as zero. Keep the page address, the capture date and the quote or screenshot with each result. Some checks use evidence from public pages, and others need data from another source. The table below sets out where each measure comes from, and what coExploro reads.
Benchmark measures, their sources and what coExploro reads
Where the measure comes from
- Positioning
- The homepage and product pages
- Pricing and plans
- The pricing page, read with the same currency and billing period
- First step for a visitor
- The opening section of the page and the public sign-up steps
- UX of the public pages
- A specialist or a tool reading the pages
- Customer evidence on the page
- Logos, testimonials and reported results the page shows
- Traffic and market share
- Traffic estimates with matching coverage, and market research for a defined market and period
- Customer satisfaction
- Surveys with the same question, scale and method, and comparable customer groups and periods
coExploro
- Positioning
- Findings from a dated capture
- Pricing and plans
- Findings when the pricing page is captured
- First step for a visitor
- Findings on the opening section and its buttons
- UX of the public pages
- A UX score in six dimensions, with findings
- Customer evidence on the page
- Findings on displayed logos, testimonials and reported results
- Traffic and market share
- Not measured
- Customer satisfaction
- Not measured
| Where the measure comes from | coExploro | |
|---|---|---|
| Positioning | The homepage and product pages | Findings from a dated capture |
| Pricing and plans | The pricing page, read with the same currency and billing period | Findings when the pricing page is captured |
| First step for a visitor | The opening section of the page and the public sign-up steps | Findings on the opening section and its buttons |
| UX of the public pages | A specialist or a tool reading the pages | A UX score in six dimensions, with findings |
| Customer evidence on the page | Logos, testimonials and reported results the page shows | Findings on displayed logos, testimonials and reported results |
| Traffic and market share | Traffic estimates with matching coverage, and market research for a defined market and period | Not measured |
| Customer satisfaction | Surveys with the same question, scale and method, and comparable customer groups and periods | Not measured |
coExploro reads public pages; it measures no traffic, market share or customer satisfaction.
Benchmark public pages in coExploro
Use coExploro’s captures and findings of public pages as evidence for your benchmark, and record each chosen check yourself with the same rules for every product. Start a separate teardown for each product in your set, or use Compare on Pro to start 2 to 5 together. Each run captures the homepage with its date and any pricing or features pages it finds, and four AI analysts draft findings on positioning, product, pricing and user experience. A teardown usually takes 2–4 minutes. Each one also gives a UX score in six dimensions and marks a dimension the capture cannot show as not observed. The Asana sample shows a finished teardown. You can try one run a day per network without an account. A free account includes 3 teardowns a month, and paid plans start at $16 a month billed yearly.
Capture equivalent pages under matching conditions
Websites change, and the same page can look different by region, device or billing setting. Capture equivalent pages within a short window you record, in the same language and region and at the same screen size. For pricing, match the currency, the billing period, the team size and the features a buyer needs. Record the address, the capture time and the page settings, and mark a page you could not capture as unknown. Close dates reduce timing differences, but they do not guarantee a fair comparison. coExploro’s methodology explains what a capture can and cannot show.
Asana, monday.com and Notion on two checks
Suppose you are reviewing which plan prices the pricing page of your own work management product shows, and which question its FAQ puts first. Here are two checks applied the same way to three competitors’ pricing pages, as inspected on 10 November 2026 from a European session, in which monday.com showed prices in euros. These checks describe content and order; to learn how easily buyers find an answer, test that task with users. First check: which of the named plan cards show a price? Each product shows prices for its plans below Enterprise, and its Enterprise card sends the buyer to sales, to a quote or to custom pricing. Second check: what question opens the pricing page’s frequently asked questions? The questions differ: AI requests at Asana, AI credits at monday.com and data use at Notion, though all three concern AI. Keep both checks even where products share a result, then apply them to your own page and write down where it differs. A difference you want to change becomes a test, with a measure you choose before you start. The cards below are findings from teardowns of the same pages captured on 29 October 2026, each showing one detail of that pricing page.
Asana · UX · Captured
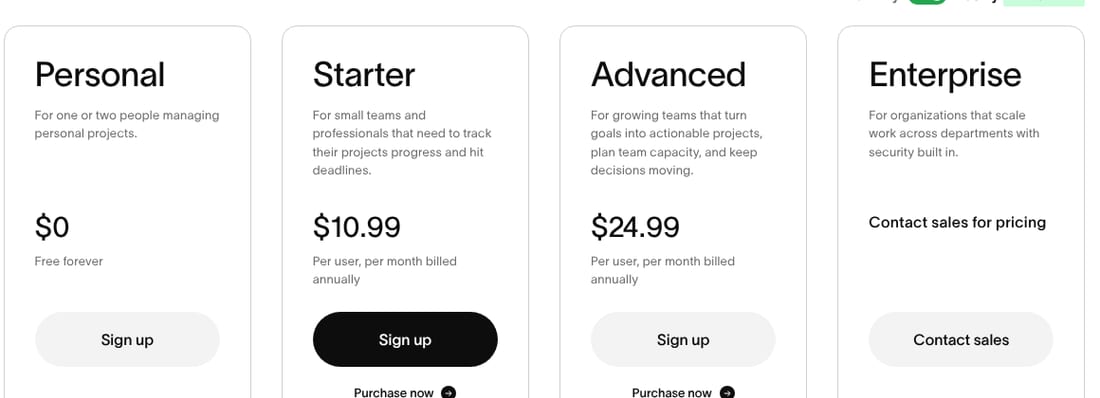
Three of the four plans show a price on the page
The capture shows the billing switch on Yearly, labelled 'Save up to 18%'. Personal shows $0 and 'Free forever', and Starter and Advanced show $10.99 and $24.99 'Per user, per month billed annually'. Enterprise shows 'Contact sales for pricing'.
Evidence:
per month billed annually
· Seen on asana.com/pricing, plan cards, under the Starter and Advanced prices · Captured · Indirect evidence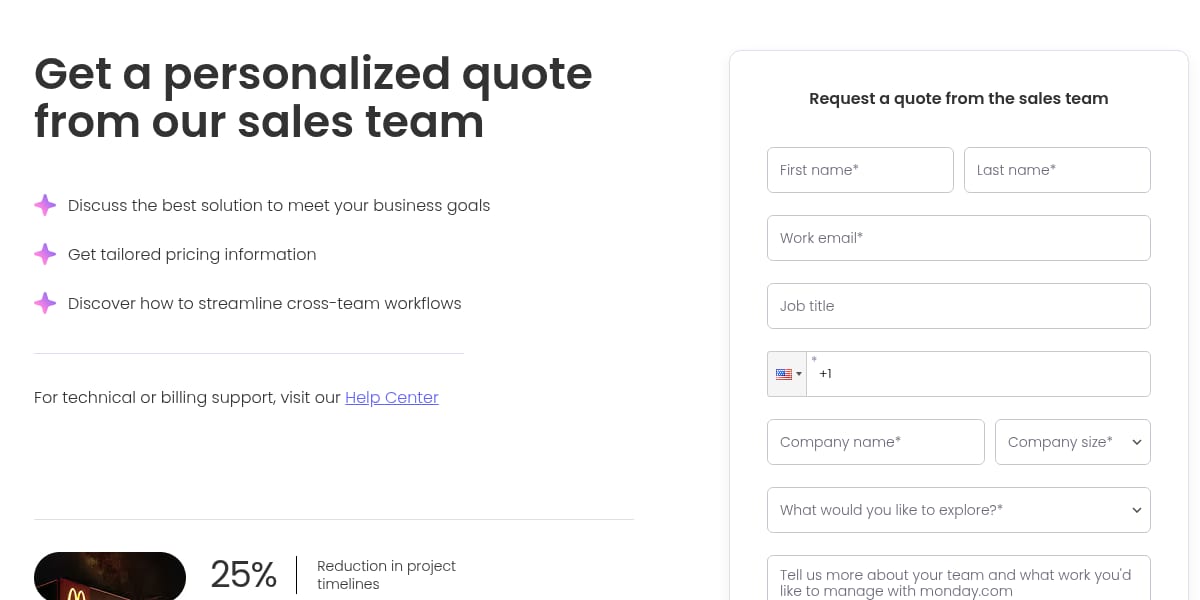
monday.com · UX · Captured
The sales quote form asks for nine inputs
The form headed 'Request a quote from the sales team' holds first name, last name, work email, job title, phone, company name, company size, 'What would you like to explore?' and a free-text box, then 'Submit'. Seven of the nine carry an asterisk. Job title and the free-text box do not.
Evidence:
Get a personalized quote from our sales team
· Seen on monday.com/pricing, pricing page, heading to the left of the quote form · Captured · Page context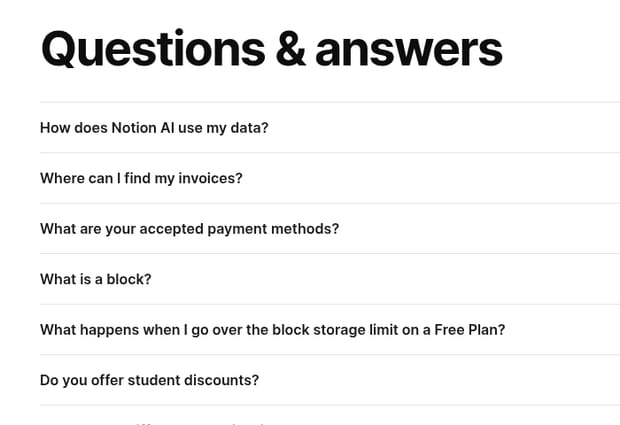
Notion · UX · Captured
Seventeen questions sit under the pricing table
The pricing FAQ, 'Questions & answers', sits below the 'Plans and features' table and lists seventeen questions. It opens with 'How does Notion AI use my data?' and only then asks 'Where can I find my invoices?' and 'What are your accepted payment methods?'
Evidence:
How does Notion AI use my data?
· Seen on www.notion.so/pricing, FAQ below the plan tables, first question · Captured · Indirect evidence
Observed by us
Asana’s pricing page showed a price for Personal, Starter and Advanced, and ‘Contact sales for pricing’ for Enterprise.
Observed by us
monday.com’s pricing page showed a price for Free, Basic, Standard and Pro, and ‘Get a quote’ for Enterprise.
Observed by us
Notion’s pricing page showed a price for Free, Plus and Business, and ‘Custom pricing’ for Enterprise.
Observed by us
Asana’s pricing FAQ opened by asking what an AI request is.
Observed by us
monday.com’s pricing FAQ opened by asking what AI credits are.
Observed by us
Notion’s pricing FAQ opened with a question about how Notion AI uses the reader’s data.
Use published scores to find what to read, not to rank
The competitor analysis examples list the Overall score and four analysts’ scores of coExploro’s public samples, each with its capture date. Their UX column is the UX analyst’s score, which is separate from the UX score in six dimensions. Use these scores to find evidence to inspect. They do not establish which product performs better, even when captures share a date. Read the findings alongside the scores: the selected findings do not explain the numerical differences between products.
What a page capture cannot benchmark
A page capture cannot establish conversion, retention, customer satisfaction or market share. Treat a figure a company publishes about them as a reported claim, with its source and period. Use your own data for your own product. For competitors, choose a data source suited to each measure, and match definitions, periods and customer groups. Use interviews with buyers to explain choices, not to estimate conversion, retention or market share, and label every estimate. Keep those results apart from the page readings, each with its own date. A benchmark that names its sources and its open questions is easier to trust than one that scores everything.
Limits
Limits of a benchmark built on public pages
- A benchmark of public pages shows what each product says and shows, not how many people buy it or stay.
- The Asana, monday.com and Notion example checks the live pages on 10 November 2026; its cards come from captures of 29 October 2026, and the pages may change.
- A shared capture date does not make scores directly comparable; check the scoring method, the pages covered and the dimensions observed.
- AI analysts draft the findings of a coExploro run; check the original capture when you can, then the live page for a current decision, and record both dates.
See it on a real product
AI Teammates are presented as named team roles · Asana
Evidence:
Your team just got bigger
· Seen on asana.com, homepage, headline of the AI Teammates block · Captured · Indirect evidenceThe homepage lists six AI controls, among them no data training · monday.com
Evidence:
No data training
· Seen on monday.com, 'Full control' block, second row, third item · Captured · Indirect evidence
Asana
Work and project management
Overall score 69 · Captured
Asana presents AI Teammates as named team roles, prices three of its four plans, and opens its pricing FAQ with three questions on AI requests.
monday.com
Work management platform
Overall score 69 · Captured
monday.com lists six AI controls on its homepage, puts a no-credit-card line under its hero button, and asks for nine inputs on its sales quote form.
Notion
Connected workspace and docs
Overall score 71 · Captured
Notion's pricing page shows Plus at $10 and Business at $20 per seat a month with 'Pay yearly' selected, and seventeen questions under its plan table.
Questions
What is competitor benchmarking?
Competitor benchmarking assesses your product against the alternatives a buyer considers, using shared measures and documented evidence. It turns a general impression into differences you can point to, each with its source and date.
How is competitor benchmarking different from competitor analysis?
Competitor analysis is the wider work of understanding competitors for a decision. Benchmarking is one part of it: a fixed set of checks, applied the same way to every product in the set, so the results can be set side by side.
Which measures should I benchmark?
Choose checks that inform your decision and that you can apply the same way to every product. On public pages these include positioning, pricing, the first step a visitor can take, the user experience (UX) of the pages and the customer evidence they show. Sales, retention, customer satisfaction and market share need other data.
How often should I benchmark competitors?
Repeat the benchmark when a decision depends on it, such as a pricing change or a launch. Keep the measures, the rules for each check and the capture conditions the same across rounds, and write down any change.
Does coExploro benchmark competitors?
coExploro makes a product teardown of each product’s public pages, with findings and a UX score. On Pro, the Compare feature starts several teardowns together and shows them side by side. It does not measure traffic, market share, sales or customer satisfaction.
Run your own
Start with one product.
Start your benchmark with one product’s public pages. Enter a homepage address, yours or a competitor’s. coExploro captures its public pages with the date, and four AI analysts draft findings on positioning, product, pricing and user experience. A run usually takes 2–4 minutes, and a free account includes 3 teardowns a month.